Woodsmoke hogs the pie (chart).
Pie being the total PM 2.5 pollution source contributions, as collected on nearly 300 24-hour filters from four sites in the Fairbanks North Star Borough.
Here’s the pie chart for the State Office Building during the most recent winter studied:

PM2.5 Source Apportionment, Fairbanks, Alaska
The pie chart for North Pole Elementary the same winter:
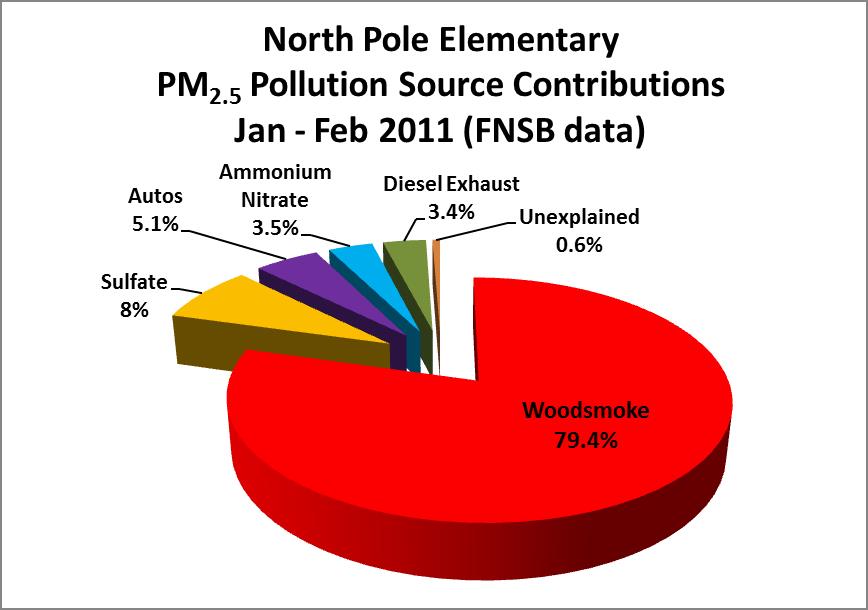
PM2.5 Source Apportionment, North Pole, Alaska
“Compared with PM2.5 concentrations in the lower 48, Fairbanks has some of the highest wintertime ambient PM2.5 concentrations measured throughout the United States.”
— 2012 PM 2.5 Source Apportionment Study for Fairbanks, Alaska
Each Winter You Breathe…
Woodsmoke, up to 81.2% – woodstove emissions [elemental potassium, potassium ion, organic carbon]
-
wood burned in stoves & boilers
-
open burning of biomass waste
-
small industrial sources
Sulfate, up to 20% – directly emitted and secondary particles formed in the atmosphere [SO4]
- coal burned for power generation and in stoves & boilers
- fuel oil used in space heating
Ammonium Nitrate, up to 10.5% – secondary particles formed in the atmosphere [NH4NO3]
- automobiles
- residential wood combustion
- coal burned for power generation and in stoves & boilers
- natural gas furnaces
Don’t be fooled by deceptive arguments that distract attention from the primary winter source. The filters don’t lie. The only way to significantly reduce PM 2.5 smoke pollution is to tackle woodsmoke at its source.
Limitations of 2012 PM 2.5 Source Apportionment Study
The study acknowledged the need for further examination to more accurately determine source contributions. Specifically, the study did not sample levoglucosan (chemical marker of wood smoke), dibenzothiophene and benzo naphtho thiophene (markers of diesel vehicles and residential oil combustion), or picene (marker for coal combustion).
The study failed to acknowledge a need to sample acrolein, formaldehyde, benzene, and polycyclic aromatic hydrocarbons (including benzo[a]pyrene and dibenzo[a,h]anthracene] — EPA-listed hazardous air pollutants released during wood combustion. [For a more complete list of the toxic chemicals in wood smoke, visit.] Alaska DEC highlights the harm to health from three of these air toxics in a fact sheet on wildfires. 60 to over 80 percent of this area’s “spectacular nonattainment” under federal air quality law comes from wood burning. Wouldn’t you think someone would want to sample Fairbanks and North Pole for air toxics?
In another unacknowledged limitation of the study, source contributions on nonattainment days were not examined separately from attainment days. Out of nearly 300 filter samples, only 73 were from days in excess of the 24-hour PM 2.5 National Ambient Air Quality Standard of 35 μg/m3. Samples from the seriously polluted 2012/2013 winter would provide ample nonattainment days to examine. Understanding our nonattainment air is essential to figuring out how to meet attainment and protect public health.
2012 PM 2.5 Source Apportionment Study
>> Link to the Study: Source Apportionment of PM2.5 in a Subarctic Airshed – Fairbanks, Alaska Tony Ward, Barbara Trost, Jim Conner, James Flanagan, R.K.M. Jayanty Aerosol and Air Quality Research, 12: 536–543, 2012
“In an effort to understand the sources of PM2.5 in the Fairbanks airshed, source apportionment using Chemical Mass Balance (CMB) modeling was conducted at four locations in Fairbanks over a three-winter period (2008/2009, 2009/2010, and 2010/2011).”
The CMB modeling revealed woodsmoke (likely residential wood combustion) was the major source of PM2.5 throughout the winter in Fairbanks, contributing between 62.7 and 81.2% of the measured PM2.5 at four sites. The other sources of PM2.5 identified by the CMB model were secondary sulfate (7.8–20%), ammonium nitrate (2.5–10.5%), diesel exhaust (not detected-9.6%), and automobiles (not detected-6.8%).
